
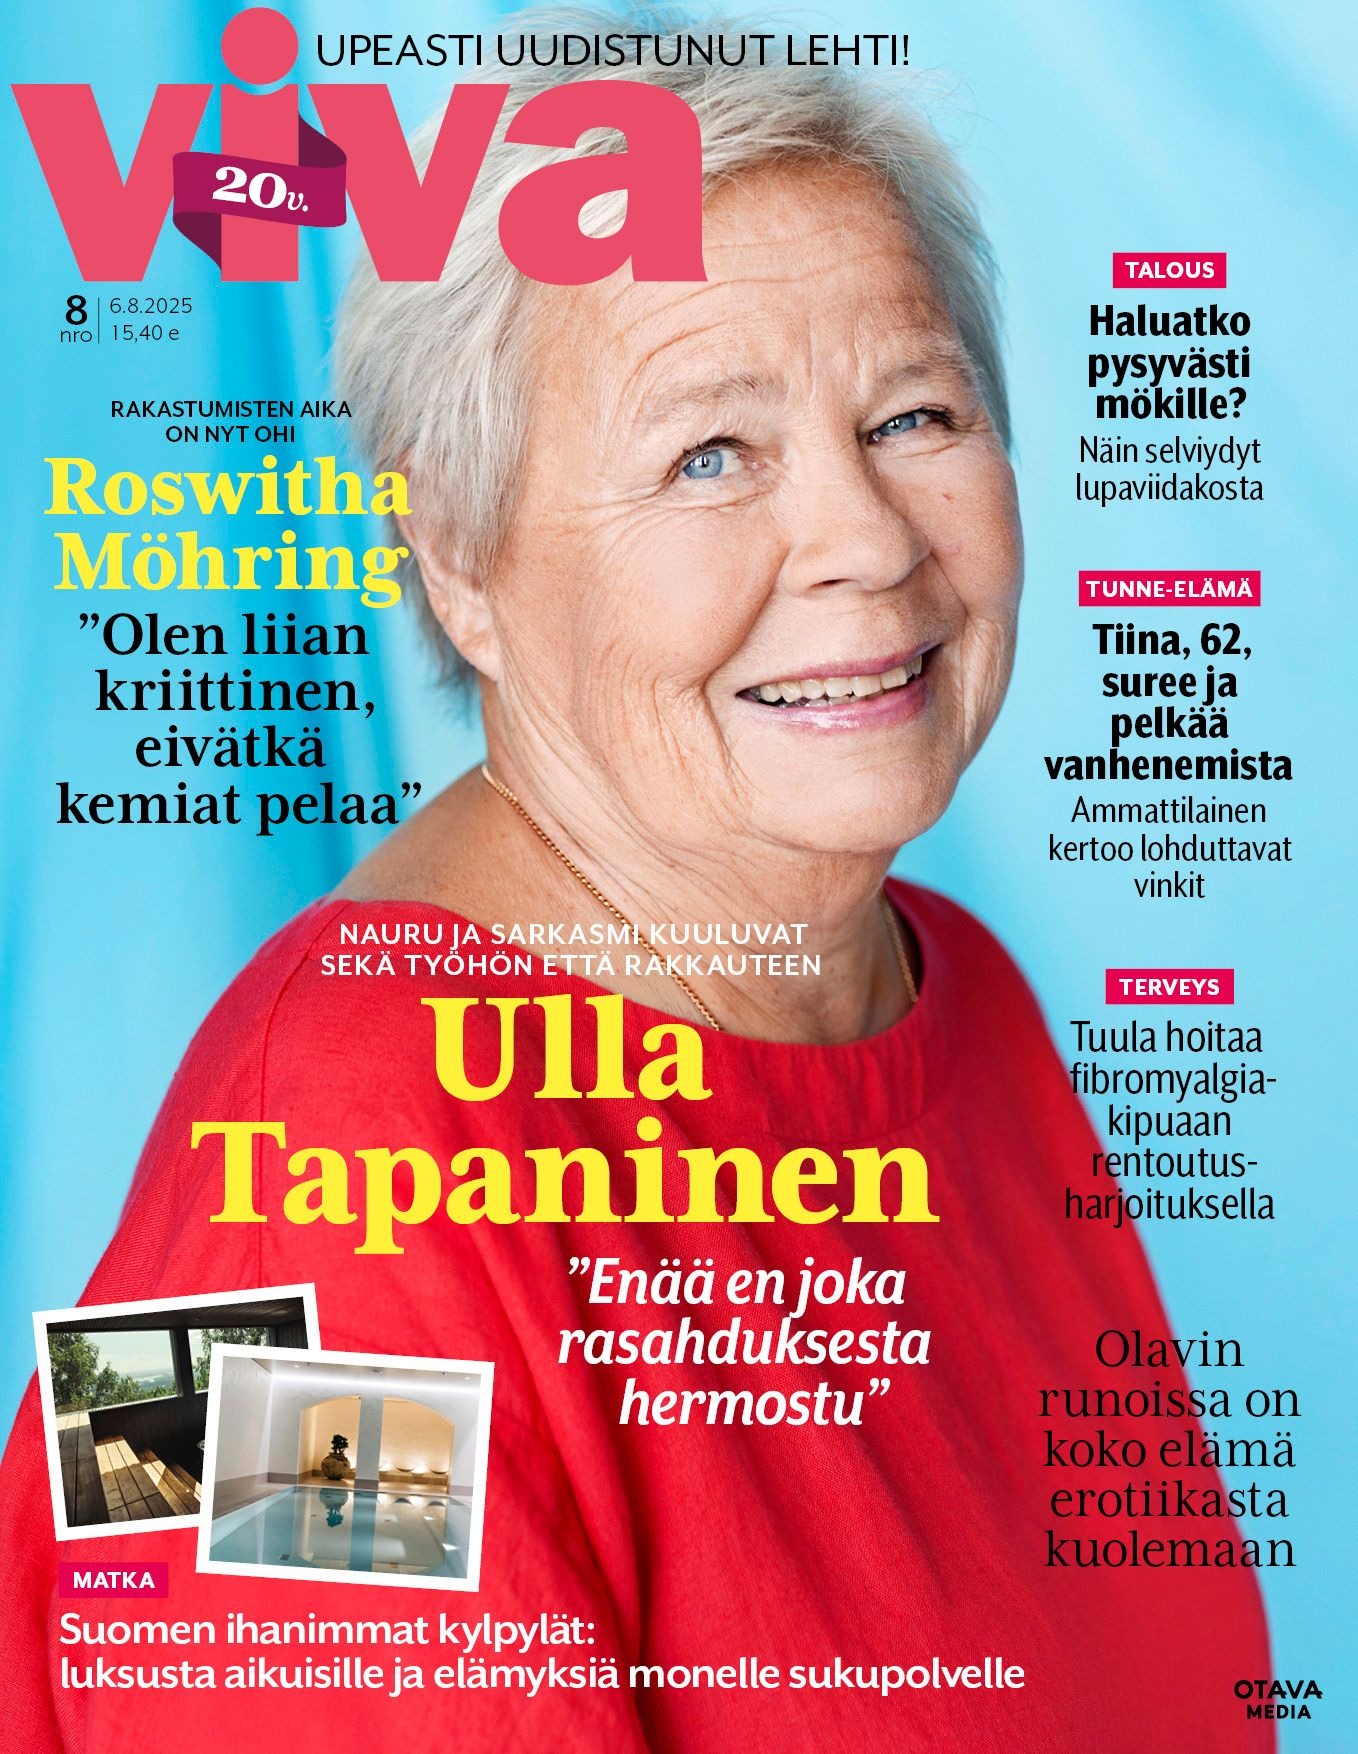
VIVA
Boldly into the third stage of life! Viva, over 20 years old, encourages Finnish adults to be brave and enjoy life to the fullest. Viva’s heartfelt reports are filled with nostalgia and shared experiences. In extensive feature articles, the joys and sorrows of life are discussed openly. Viva guides and inspires its readers to exercise, take care of their health, and find their own style. Colorful culture and travel articles encourage readers to venture out boldly. Useful information about health, living, saving, pensions, and inheritance matters is highly valued content in Viva. With its topics, Viva speaks to adult women and also to the men in their lives. The magazine is published 12 times a year. Viva’s online content and digital edition can be found on the Anna.fi website.
Issues per year
12 issues per year
Magazine website
Magazine in Social Media
Timetables
| Issue | Issue | Booking Date | Material Date | Themes and info |
|---|---|---|---|---|
| 1 | 7.1.2026 | 5.12.2025 | 10.12.2025 | Dream holidays and relief for travel fever. Pamper winter skin. Gut health. |
| 2 | 4.2.2026 | 14.1.2026 | 19.1.2026 | Finance theme: make your money last. Beautifully made-up skin. Oral health care. |
| 3 | 4.3.2026 | 11.2.2026 | 16.2.2026 | Time to start using sunscreen. Sexuality as a source of strength for seniors. Who benefits from mini-leasing? |
| 4 | 1.4.2026 | 11.3.2026 | 16.3.2026 | Memory extra. Radiant and beautiful hair color. Tax tips for retirees. |
| 5 | 6.5.2026 | 14.4.2026 | 17.4.2026 | Know your roots and family. Wellbeing for caregivers. Charming dresses for summer events. |
| 6 | 3.6.2026 | 12.5.2026 | 18.5.2026 | Lovely summer trips in Finland. Stunning swimsuits of the season. The impact of fluid balance on wellbeing. |
| 7 | 1.7.2026 | 9.6.2026 | 12.6.2026 | Local travel. Love gives strength. Hormonal balance for mature women. |
| 8 | 5.8.2026 | 15.7.2026 | 20.7.2026 | New beginnings: it's never too late to fulfill your dreams. Fix your sleep rhythm. Smart inheritance planning. |
| 9 | 2.9.2026 | 12.8.2026 | 17.8.2026 | Independent living. Shoes and coats that protect from the elements. Pay attention to cholesterol. |
| 10 | 7.10.2026 | 16.9.2026 | 21.9.2026 | Pink ribbon and life with cancer. Strengthen thin skin. Best new books for autumn. |
| 11 | 4.11.2026 | 14.10.2026 | 19.10.2026 | Blow-drying school and volume for hair. Ease digestive issues. How to improve home safety. |
| 12 | 9.12.2026 | 18.11.2026 | 23.11.2026 | Lovely lingerie and sleepwear. Pets bring wellbeing to life. Where to find new friends. |
Ei aikatauluja vuodelle 2027.
Prices
| Ad | Placement | Size | Bleed | Price (tax 0%) |
|---|---|---|---|---|
| 2/1 landscape | Not specified | 460 x 297 mm | 5 mm | 8 270 € |
| 1/1 portrait | Not specified | 230 x 297 mm | 5 mm | 4 590 € |
| 1/1 portrait | 2. Cover | 230 x 297 mm | 5 mm | 5 060 € |
| 1/1 portrait | 3. Cover | 230 x 297 mm | 5 mm | 5 060 € |
| 1/1 Takakansi portrait | Back cover | 230 x 267 mm | 5 mm | 5 060 € |
| 1/2 Pysty portrait | Not specified | 111 x 297 mm | 5 mm | 3 120 € |
| 1/2 vaaka landscape | Not specified | 230 x 146 mm | 5 mm | 3 120 € |
| 1/4 Pysty portrait | Not specified | 61 x 297 mm | 5 mm | 2 300 € |
| 1/4 vaaka landscape | Not specified | 230 x 70 mm | 5 mm | 2 300 € |
| 1/4 neliö square | Not specified | 111 x 146 mm | 5 mm | 2 300 € | *) size without marginal Prices valid until 31.12.2026 |
Size
230 x 297 mm
Printing method
Offset
Binding
Printer
PunaMusta Oy
Delivery of ad material and instructions
Varauksen yhteydessä mainostajalle/aineiston toimittajalle lähtee sähköposti sisältäen linkin aineistontoimitusta varten. Linkkiin sisältyy kaikki kampanjaan/varaukseen liittyvät mediat.
ICC profile
Technical information
Terms of delivery
Check the delivery conditions from the publisher
| Ad | Placement | Size | Bleed | Price (tax 0%) | *) size without marginal Prices valid until 31.12.2027 |
|---|
Size
230 x 297 mm
Printing method
Offset
Binding
Stiftaus
Printer
PunaMusta Oy
Delivery of ad material and instructions
Varauksen yhteydessä mainostajalle/aineiston toimittajalle lähtee sähköposti sisältäen linkin aineistontoimitusta varten. Linkkiin sisältyy kaikki kampanjaan/varaukseen liittyvät mediat.
ICC profile
Technical information
"
Terms of delivery
Check the delivery conditions from the publisher
| Ad | Description | Placement | Size | Price (tax 0%) |
|---|---|---|---|---|
| Desktop | 980×400 px | 30 € / CPM (Cost per thousand) | ||
| Desktop | 980×120 px | 12 € / CPM (Cost per thousand) | ||
| Desktop | 300×250 px | 8 € / CPM (Cost per thousand) | ||
| Desktop | 300×500 px | 12 € / CPM (Cost per thousand) | ||
| Desktop | 300×750 px | 16 € / CPM (Cost per thousand) | ||
| Desktop | 468×400 px | 10 € / CPM (Cost per thousand) | ||
| Desktop | 560×400 px | 14 € / CPM (Cost per thousand) | ||
| Desktop | 160×600 px | 8 € / CPM (Cost per thousand) | ||
| Desktop | px | 18 € / CPM (Cost per thousand) | ||
| Mobile | 300×300 px | 18 € / CPM (Cost per thousand) | ||
| Mobile | 300×150 px | 12 € / CPM (Cost per thousand) | ||
| Mobile | px | 18 € / CPM (Cost per thousand) | ||
| Desktop | 980x552 px | 40 € / CPM (Cost per thousand) | Prices valid until 31.12.2026 |
| Ad | Description | Size | Price (tax 0%) |
Prices valid until 31.12.2027 |
|---|
Readers
Gender
Audience in digital and print
Age
Municipality type
Education
Gross household income, daily purchases
NRS Facts
Print readers include only those who read the printed magazine.
|
Readers 66 600
Minutes of reading86 min
How many times read2,5
|
Reader profile | All 15+ % | Magazine Readers % | Amount of readers |
|---|---|---|---|---|
| Sex | Women | 51 | 81 | 53 900 |
| Men | 49 | 19 | 12 700 | |
| Native language | Finnish | 95 | 98 | 65 300 |
| Swedish | 5 | 2 | 1 300 | |
| Age | 15-24 y | 13 | 4 | 2 700 |
| 25-34 y | 14 | 2 | 1 300 | |
| 35-44 y | 14 | 3 | 2 000 | |
| 45-54 y | 14 | 2 | 1 300 | |
| 55-64 y | 15 | 8 | 5 300 | |
| 65+ y | 30 | 82 | 54 600 | |
| Gender + age | Female 15-29 years | 9 | 1 | 700 |
| Female 30-49 years | 14 | 2 | 1 300 | |
| Female 50+ years | 28 | 78 | 51 900 | |
| Male 15-29 years | 10 | 4 | 2 700 | |
| Male 30-49 years | 15 | 3 | 2 000 | |
| Male 50+ years | 24 | 13 | 8 700 | |
| Household position | Lives at home with parents | 7 | 3 | 2 000 |
| Lives alone | 29 | 40 | 26 600 | |
| Lives with spouse | 36 | 49 | 32 600 | |
| Lives with spouse and children | 24 | 4 | 2 700 | |
| Single parent | 2 | 1 | 700 | |
| Other | 3 | 2 | 1 300 | |
| Grandchildren under 18 years of age | Yes | 20 | 38 | 25 300 |
| No | 39 | 54 | 36 000 | |
| No answer (under 45 year olds) | 41 | 8 | 5 300 | |
| Education | Elementary school | 4 | 11 | 7 300 |
| Secondary school | 6 | 13 | 8 700 | |
| Vocational | 27 | 30 | 20 000 | |
| High school | 13 | 10 | 6 700 | |
| University of Applied Sciences | 20 | 12 | 8 000 | |
| University | 28 | 20 | 13 300 | |
| Something else | 2 | 4 | 2 700 | |
| Decision-maker in grocery purchases | Yes | 93 | 95 | 63 300 |
| No | 6 | 5 | 3 300 | |
| Can not say | 1 | 1 | 700 | |
| Use of glasses or contact lenses | Yes | 68 | 90 | 59 900 |
| No | 32 | 10 | 6 700 | |
| Size of the household | 1 pers | 28 | 45 | 30 000 |
| 2 pers | 38 | 46 | 30 600 | |
| 3 pers | 14 | 4 | 2 700 | |
| 4 pers | 12 | 2 | 1 300 | |
| 5+ pers | 7 | 2 | 1 300 | |
| Household income (gross) | Below 20 000 € /y | 10 | 10 | 6 700 |
| 20 000 - 35 000 € /y | 17 | 35 | 23 300 | |
| 35 001 - 50 000 € /y | 18 | 26 | 17 300 | |
| 50 001 - 85 000 € /y | 21 | 11 | 7 300 | |
| 85 001 - 100 000 € /y | 8 | 3 | 2 000 | |
| Over 100 000 € /y | 10 | 2 | 1 300 | |
| Dont want to tell | 5 | 6 | 4 000 | |
| Cant say / No answer | 10 | 7 | 4 700 | |
| Family with kids | Yes | 32 | 7 | 4 700 |
| No | 68 | 93 | 61 900 | |
| Number of children in the household (5th grade) | 1 child | 13 | 4 | 2 700 |
| 2 children | 13 | 1 | 700 | |
| 3 children | 5 | 1 | 700 | |
| 4 children | 1 | 0 | 0 | |
| 5+ children | 1 | 1 | 700 | |
| There are no children | 67 | 93 | 61 900 | |
| Doesn't want to answer | 0 | 0 | 0 | |
| Pets in household | Cat | 16 | 13 | 8 700 |
| Dog | 26 | 13 | 8 700 | |
| Some other pet | 5 | 2 | 1 300 | |
| No pets | 61 | 74 | 49 300 | |
| Health services used in the household | Public health services | 85 | 92 | 61 300 |
| Employer - funded health care services | 50 | 15 | 10 000 | |
| Private, self-funded healthcare services | 39 | 51 | 34 000 | |
| Private health insurance services | 26 | 13 | 8 700 | |
| No health care | 1 | 0 | 0 | |
| Can not say | 1 | 1 | 700 | |
| Housing | Apartment | 32 | 37 | 24 600 |
| Row house or semi-detached house | 17 | 16 | 10 700 | |
| Detached house | 46 | 40 | 26 600 | |
| Farm | 4 | 4 | 2 700 | |
| Something else | 1 | 2 | 1 300 | |
| Can not say | 0 | 0 | 0 | |
| Ownership of housing | Owner-occupied residence | 76 | 82 | 54 600 |
| Rented residence | 20 | 14 | 9 300 | |
| Right of residence apartment | 2 | 2 | 1 300 | |
| Something else | 1 | 1 | 700 | |
| Can not say | 1 | 1 | 700 | |
| Cottage or holiday home in regular use | Yes | 41 | 46 | 30 600 |
| No | 58 | 54 | 36 000 | |
| Can not say | 1 | 1 | 700 | |
| Number of cars in household | One car | 45 | 53 | 35 300 |
| Two cars | 30 | 23 | 15 300 | |
| Three or more cars | 10 | 4 | 2 700 | |
| No car | 14 | 20 | 13 300 | |
| Type of car, if buying now | New | 21 | 22 | 14 700 |
| Used | 70 | 56 | 37 300 | |
| Company car | 5 | 1 | 700 | |
| Leasing (personal) | 9 | 5 | 3 300 | |
| Shared car | 3 | 2 | 1 300 | |
| Doesn't use a car | 8 | 18 | 12 000 | |
| Can not say | 5 | 7 | 4 700 | |
| Advertising ban at the door / mailbox | Yes | 27 | 14 | 9 300 |
| No | 72 | 86 | 57 300 | |
| Can not say | 1 | 1 | 700 | |
| Using AdBlocker or similar application | Yes | 19 | 5 | 3 300 |
| No | 76 | 88 | 58 600 | |
| Can not say | 5 | 7 | 4 700 | |
| Type of municipality (7 class) | Greater Helsinki | 19 | 11 | 7 300 |
| Turku or Tampere | 8 | 8 | 5 300 | |
| Oulu | 4 | 6 | 4 000 | |
| 70 000 - 150 000 inhabitants town | 14 | 17 | 11 300 | |
| Urban municipality | 25 | 26 | 17 300 | |
| Conurbation | 16 | 15 | 10 000 | |
| Countryside | 13 | 17 | 11 300 | Source: NRS 2025 |
| How often different content is read | All 15+ % | Magazine Readers % | Amount of readers | |
|---|---|---|---|---|
| The frequency of reading: Print magazines | Daily | 12 | 36 | 24 000 |
| 5-6 days a week | 4 | 9 | 6 000 | |
| 1-4 days a week | 24 | 36 | 24 000 | |
| Monthly | 25 | 9 | 6 000 | |
| Rarely | 26 | 5 | 3 300 | |
| Never | 8 | 5 | 3 300 | |
| Can not say | 1 | 1 | 700 | |
| The frequency of reading: Magazine content in digital format | Daily | 23 | 16 | 10 700 |
| 5-6 days a week | 5 | 9 | 6 000 | |
| 1-4 days a week | 20 | 15 | 10 000 | |
| Monthly | 15 | 7 | 4 700 | |
| Rarely | 23 | 24 | 16 000 | |
| Never | 13 | 25 | 16 600 | |
| Can not say | 1 | 4 | 2 700 | |
| The frequency of reading: Print newspapers or afternoon papers | Daily | 25 | 65 | 43 300 |
| 5-6 days a week | 5 | 5 | 3 300 | |
| 1-4 days a week | 23 | 17 | 11 300 | |
| Monthly | 15 | 4 | 2 700 | |
| Rarely | 24 | 7 | 4 700 | |
| Never | 8 | 2 | 1 300 | |
| Can not say | 1 | 0 | 0 | |
| The frequency of reading: Newspaper or afternoon paper content in digital format | Daily | 54 | 43 | 28 600 |
| 5-6 days a week | 9 | 7 | 4 700 | |
| 1-4 days a week | 17 | 16 | 10 700 | |
| Monthly | 6 | 3 | 2 000 | |
| Rarely | 8 | 13 | 8 700 | |
| Never | 5 | 19 | 12 700 | |
| Can not say | 0 | 0 | 0 | |
| The frequency of reading: Free and free delivery newspapers | Daily | 4 | 7 | 4 700 |
| 5-6 days a week | 4 | 8 | 5 300 | |
| 1-4 days a week | 41 | 56 | 37 300 | |
| Monthly | 18 | 13 | 8 700 | |
| Rarely | 23 | 13 | 8 700 | |
| Never | 9 | 3 | 2 000 | |
| Can not say | 1 | 0 | 0 | |
| The frequency of watching: Free online TV services | Daily | 17 | 21 | 14 000 |
| 5-6 days a week | 10 | 9 | 6 000 | |
| 1-4 days a week | 30 | 25 | 16 600 | |
| Monthly | 21 | 18 | 12 000 | |
| Rarely | 15 | 13 | 8 700 | |
| Never | 6 | 13 | 8 700 | |
| Can not say | 1 | 1 | 700 | |
| The frequency of watching: Pay TV and streaming services | Daily | 15 | 8 | 5 300 |
| 5-6 days a week | 10 | 5 | 3 300 | |
| 1-4 days a week | 22 | 11 | 7 300 | |
| Monthly | 9 | 7 | 4 700 | |
| Rarely | 13 | 13 | 8 700 | |
| Never | 30 | 55 | 36 600 | |
| Can not say | 1 | 1 | 700 | |
| The frequency of watching: Programs of YLE (national broadcaster) TV channels | Daily | 44 | 71 | 47 300 |
| 5-6 days a week | 10 | 9 | 6 000 | |
| 1-4 days a week | 19 | 9 | 6 000 | |
| Monthly | 12 | 4 | 2 700 | |
| Rarely | 12 | 6 | 4 000 | |
| Never | 3 | 1 | 700 | |
| Can not say | 0 | 0 | 0 | |
| The frequency of watching: Programs of commercial TV channels | Daily | 33 | 49 | 32 600 |
| 5-6 days a week | 12 | 9 | 6 000 | |
| 1-4 days a week | 22 | 19 | 12 700 | |
| Monthly | 12 | 5 | 3 300 | |
| Rarely | 13 | 7 | 4 700 | |
| Never | 8 | 10 | 6 700 | |
| Can not say | 0 | 1 | 700 | |
| The frequency of listening: Programs of YLE (national broadcaster) radio-channels | Daily | 21 | 38 | 25 300 |
| 5-6 days a week | 6 | 7 | 4 700 | |
| 1-4 days a week | 16 | 15 | 10 000 | |
| Monthly | 13 | 9 | 6 000 | |
| Rarely | 27 | 19 | 12 700 | |
| Never | 15 | 11 | 7 300 | |
| Can not say | 1 | 1 | 700 | |
| The frequency of listening: Programs of commercial radio channels | Daily | 16 | 11 | 7 300 |
| 5-6 days a week | 9 | 5 | 3 300 | |
| 1-4 days a week | 21 | 16 | 10 700 | |
| Monthly | 14 | 12 | 8 000 | |
| Rarely | 23 | 22 | 14 700 | |
| Never | 16 | 31 | 20 600 | |
| Can not say | 1 | 2 | 1 300 | |
| The frequency of listening: Podcasts | Daily | 6 | 2 | 1 300 |
| 5-6 days a week | 3 | 2 | 1 300 | |
| 1-4 days a week | 11 | 5 | 3 300 | |
| Monthly | 14 | 6 | 4 000 | |
| Rarely | 27 | 29 | 19 300 | |
| Never | 36 | 51 | 34 000 | |
| Can not say | 2 | 5 | 3 300 | |
| User frequency and following: Social media | Daily | 59 | 47 | 31 300 |
| 5-6 days a week | 8 | 6 | 4 000 | |
| 1-4 days a week | 8 | 8 | 5 300 | |
| Monthly | 3 | 4 | 2 700 | |
| Rarely | 6 | 6 | 4 000 | |
| Never | 16 | 26 | 17 300 | |
| Can not say | 0 | 2 | 1 300 | |
| User frequency and following: Bloggers, YouTubers, or social media influencers | Daily | 14 | 7 | 4 700 |
| 5-6 days a week | 6 | 2 | 1 300 | |
| 1-4 days a week | 13 | 8 | 5 300 | |
| Monthly | 8 | 5 | 3 300 | |
| Rarely | 20 | 20 | 13 300 | |
| Never | 38 | 56 | 37 300 | |
| Can not say | 1 | 1 | 700 | |
| User frequency: Instant messaging | Daily | 69 | 48 | 32 000 |
| 5-6 days a week | 11 | 15 | 10 000 | |
| 1-4 days a week | 9 | 17 | 11 300 | |
| Monthly | 3 | 5 | 3 300 | |
| Rarely | 2 | 3 | 2 000 | |
| Never | 6 | 10 | 6 700 | |
| Can not say | 0 | 2 | 1 300 | |
| Reading frequency: Printed books | Daily | 16 | 32 | 21 300 |
| 5-6 days a week | 6 | 8 | 5 300 | |
| 1-4 days a week | 14 | 17 | 11 300 | |
| Monthly | 22 | 19 | 12 700 | |
| Rarely | 34 | 19 | 12 700 | |
| Never | 7 | 4 | 2 700 | |
| Can not say | 1 | 0 | 0 | |
| Reading frequency: E-books | Daily | 3 | 3 | 2 000 |
| 5-6 days a week | 1 | 1 | 700 | |
| 1-4 days a week | 4 | 3 | 2 000 | |
| Monthly | 7 | 4 | 2 700 | |
| Rarely | 30 | 21 | 14 000 | |
| Never | 53 | 68 | 45 300 | |
| Can not say | 1 | 1 | 700 | |
| Listening frequency: Audiobooks | Daily | 6 | 5 | 3 300 |
| 5-6 days a week | 3 | 2 | 1 300 | |
| 1-4 days a week | 6 | 4 | 2 700 | |
| Monthly | 8 | 5 | 3 300 | |
| Rarely | 23 | 16 | 10 700 | |
| Never | 54 | 67 | 44 600 | |
| Can not say | 1 | 1 | 700 | |
| Usage/viewing frequency: YouTube | Daily | 19 | 10 | 6 700 |
| 5-6 days a week | 9 | 6 | 4 000 | |
| 1-4 days a week | 23 | 17 | 11 300 | |
| Monthly | 21 | 20 | 13 300 | |
| Rarely | 17 | 24 | 16 000 | |
| Never | 10 | 22 | 14 700 | |
| Can not say | 0 | 1 | 700 | |
| Usage/following: Linkedl | Daily | 4 | 1 | 700 |
| 5-6 days a week | 2 | 1 | 700 | |
| 1-4 days a week | 8 | 2 | 1 300 | |
| Monthly | 8 | 2 | 1 300 | |
| Rarely | 12 | 9 | 6 000 | |
| Never | 59 | 71 | 47 300 | |
| Cant say / No answer | 6 | 14 | 9 300 | |
| Usage/following: Facebook | Daily | 39 | 40 | 26 600 |
| 5-6 days a week | 8 | 9 | 6 000 | |
| 1-4 days a week | 11 | 7 | 4 700 | |
| Monthly | 6 | 4 | 2 700 | |
| Rarely | 9 | 6 | 4 000 | |
| Never | 22 | 25 | 16 600 | |
| Cant say / No answer | 4 | 10 | 6 700 | |
| Usage/Following: Instagram | Daily | 32 | 16 | 10 700 |
| 5-6 days a week | 7 | 5 | 3 300 | |
| 1-4 days a week | 9 | 8 | 5 300 | |
| Monthly | 5 | 4 | 2 700 | |
| Rarely | 9 | 10 | 6 700 | |
| Never | 33 | 46 | 30 600 | |
| Cant say / No answer | 5 | 10 | 6 700 | |
| Usage/following rate: Snapchat | Daily | 15 | 3 | 2 000 |
| 5-6 days a week | 2 | 1 | 700 | |
| 1-4 days a week | 3 | 1 | 700 | |
| Monthly | 2 | 0 | 0 | |
| Rarely | 5 | 4 | 2 700 | |
| Never | 69 | 78 | 51 900 | |
| Cant say / No answer | 5 | 12 | 8 000 | |
| Usage/Following: Twitter | Daily | 5 | 4 | 2 700 |
| 5-6 days a week | 2 | 1 | 700 | |
| 1-4 days a week | 4 | 1 | 700 | |
| Monthly | 5 | 2 | 1 300 | |
| Rarely | 11 | 6 | 4 000 | |
| Never | 68 | 75 | 50 000 | |
| Cant say / No answer | 5 | 12 | 8 000 | |
| Usage/Following: TikTok | Daily | 10 | 3 | 2 000 |
| 5-6 days a week | 3 | 1 | 700 | |
| 1-4 days a week | 4 | 3 | 2 000 | |
| Monthly | 3 | 2 | 1 300 | |
| Rarely | 8 | 7 | 4 700 | |
| Never | 68 | 74 | 49 300 | |
| Cant say / No answer | 4 | 10 | 6 700 | Source: NRS 2025 |
| Consumer claims | All 15+ % | Magazine Readers % | Amount of readers | |
|---|---|---|---|---|
| I enjoy shopping | Completely agree | 14 | 12 | 8 000 |
| Partially agree | 43 | 39 | 26 000 | |
| Partially disagree | 30 | 35 | 23 300 | |
| Completely disagree | 10 | 11 | 7 300 | |
| Can not say | 3 | 3 | 2 000 | |
| I prefer domestic products | Completely agree | 33 | 41 | 27 300 |
| Partially agree | 55 | 51 | 34 000 | |
| Partially disagree | 9 | 5 | 3 300 | |
| Completely disagree | 1 | 0 | 0 | |
| Can not say | 2 | 2 | 1 300 | |
| I consciously make responsible choices in my consumption | Completely agree | 20 | 28 | 18 600 |
| Partially agree | 54 | 56 | 37 300 | |
| Partially disagree | 18 | 11 | 7 300 | |
| Completely disagree | 4 | 2 | 1 300 | |
| Can not say | 3 | 4 | 2 700 | |
| When shopping, quality is more important to me than price | Completely agree | 23 | 24 | 16 000 |
| Partially agree | 58 | 59 | 39 300 | |
| Partially disagree | 15 | 13 | 8 700 | |
| Completely disagree | 1 | 1 | 700 | |
| Can not say | 2 | 3 | 2 000 | |
| I usually choose the cheapest option | Completely agree | 12 | 9 | 6 000 |
| Partially agree | 48 | 54 | 36 000 | |
| Partially disagree | 33 | 29 | 19 300 | |
| Completely disagree | 5 | 6 | 4 000 | |
| Can not say | 2 | 2 | 1 300 | |
| I often take advantage of discount and campaign prices in my purchases | Completely agree | 37 | 40 | 26 600 |
| Partially agree | 50 | 49 | 32 600 | |
| Partially disagree | 9 | 8 | 5 300 | |
| Completely disagree | 2 | 3 | 2 000 | |
| Can not say | 1 | 0 | 0 | |
| In my circle of friends, I am often the first to try new things | Completely agree | 6 | 5 | 3 300 |
| Partially agree | 24 | 13 | 8 700 | |
| Partially disagree | 38 | 45 | 30 000 | |
| Completely disagree | 24 | 23 | 15 300 | |
| Can not say | 9 | 14 | 9 300 | |
| In my opinion, money is for consumption and not for saving | Completely agree | 5 | 4 | 2 700 |
| Partially agree | 36 | 33 | 22 000 | |
| Partially disagree | 45 | 47 | 31 300 | |
| Completely disagree | 11 | 13 | 8 700 | |
| Can not say | 4 | 2 | 1 300 | |
| I prefer local shops and services | Completely agree | 27 | 40 | 26 600 |
| Partially agree | 58 | 55 | 36 600 | |
| Partially disagree | 11 | 4 | 2 700 | |
| Completely disagree | 1 | 0 | 0 | |
| Can not say | 2 | 1 | 700 | |
| I want to see advertising targeted to me based on my online behavior | Completely agree | 4 | 3 | 2 000 |
| Partially agree | 28 | 24 | 16 000 | |
| Partially disagree | 29 | 25 | 16 600 | |
| Completely disagree | 32 | 35 | 23 300 | |
| Can not say | 7 | 13 | 8 700 | |
| When I want a certain brand of product, the price doesn't matter | Completely agree | 9 | 10 | 6 700 |
| Partially agree | 32 | 31 | 20 600 | |
| Partially disagree | 37 | 40 | 26 600 | |
| Completely disagree | 20 | 16 | 10 700 | |
| Can not say | 2 | 3 | 2 000 | |
| I prefer certified products in my purchases (e.g. Fairtrade, The Nordic Swan Ecolabel, Avainlippu) | Completely agree | 16 | 21 | 14 000 |
| Partially agree | 50 | 56 | 37 300 | |
| Partially disagree | 24 | 18 | 12 000 | |
| Completely disagree | 6 | 2 | 1 300 | |
| Can not say | 4 | 3 | 2 000 | |
| Ecology is an important purchase reason for me | Completely agree | 17 | 19 | 12 700 |
| Partially agree | 51 | 57 | 38 000 | |
| Partially disagree | 22 | 17 | 11 300 | |
| Completely disagree | 6 | 2 | 1 300 | |
| Can not say | 3 | 4 | 2 700 | |
| I prefer well-known brands | Completely agree | 12 | 8 | 5 300 |
| Partially agree | 58 | 57 | 38 000 | |
| Partially disagree | 21 | 22 | 14 700 | |
| Completely disagree | 5 | 8 | 5 300 | |
| Can not say | 3 | 5 | 3 300 | |
| I prefer used products in my purchases | Completely agree | 14 | 11 | 7 300 |
| Partially agree | 41 | 39 | 26 000 | |
| Partially disagree | 31 | 33 | 22 000 | |
| Completely disagree | 12 | 14 | 9 300 | |
| Can not say | 3 | 3 | 2 000 | Source: NRS 2025 |
| Attitude towards advertising in different media channels | All 15+ % | Magazine Readers % | Amount of readers | |
|---|---|---|---|---|
| Newspapers | Very positive | 13 | 15 | 10 000 |
| Quite positively | 61 | 65 | 43 300 | |
| Quite negatively | 16 | 13 | 8 700 | |
| Very negative | 4 | 2 | 1 300 | |
| Can not say | 6 | 5 | 3 300 | |
| Magazines | Very positive | 13 | 13 | 8 700 |
| Quite positively | 60 | 62 | 41 300 | |
| Quite negatively | 17 | 17 | 11 300 | |
| Very negative | 4 | 2 | 1 300 | |
| Can not say | 6 | 5 | 3 300 | |
| Free and local newspapers | Very positive | 24 | 27 | 18 000 |
| Quite positively | 56 | 56 | 37 300 | |
| Quite negatively | 11 | 10 | 6 700 | |
| Very negative | 4 | 1 | 700 | |
| Can not say | 6 | 5 | 3 300 | |
| Newspaper/Magazine websites or applications | Very positive | 7 | 8 | 5 300 |
| Quite positively | 45 | 43 | 28 600 | |
| Quite negatively | 30 | 25 | 16 600 | |
| Very negative | 10 | 6 | 4 000 | |
| Can not say | 8 | 18 | 12 000 | |
| Social media (Facebook, Instagram etc.) | Very positive | 6 | 3 | 2 000 |
| Quite positively | 33 | 34 | 22 600 | |
| Quite negatively | 32 | 27 | 18 000 | |
| Very negative | 17 | 14 | 9 300 | |
| Can not say | 12 | 22 | 14 700 | |
| Blogs | Very positive | 4 | 2 | 1 300 |
| Quite positively | 25 | 16 | 10 700 | |
| Quite negatively | 29 | 21 | 14 000 | |
| Very negative | 16 | 17 | 11 300 | |
| Can not say | 26 | 45 | 30 000 | |
| Newsletters to email | Very positive | 2 | 1 | 700 |
| Quite positively | 17 | 18 | 12 000 | |
| Quite negatively | 34 | 40 | 26 600 | |
| Very negative | 43 | 36 | 24 000 | |
| Can not say | 4 | 5 | 3 300 | |
| Other websites | Very positive | 3 | 1 | 700 |
| Quite positively | 38 | 30 | 20 000 | |
| Quite negatively | 34 | 35 | 23 300 | |
| Very negative | 14 | 15 | 10 000 | |
| Can not say | 11 | 19 | 12 700 | |
| Commercial TV channels (MTV3, Nelonen, Sub, FOX etc.) | Very positive | 7 | 5 | 3 300 |
| Quite positively | 46 | 43 | 28 600 | |
| Quite negatively | 29 | 35 | 23 300 | |
| Very negative | 13 | 11 | 7 300 | |
| Can not say | 4 | 6 | 4 000 | |
| Commercial radio channels (Radio Nova, SuomiPOP, NRJ, Iskelmä etc.) | Very positive | 4 | 2 | 1 300 |
| Quite positively | 35 | 30 | 20 000 | |
| Quite negatively | 33 | 35 | 23 300 | |
| Very negative | 20 | 23 | 15 300 | |
| Can not say | 7 | 11 | 7 300 | |
| Home delivered advertisements and catalogues | Very positive | 19 | 22 | 14 700 |
| Quite positively | 46 | 52 | 34 600 | |
| Quite negatively | 17 | 14 | 9 300 | |
| Very negative | 14 | 8 | 5 300 | |
| Can not say | 5 | 4 | 2 700 | |
| Out-of-home advertising | Very positive | 11 | 4 | 2 700 |
| Quite positively | 52 | 49 | 32 600 | |
| Quite negatively | 21 | 28 | 18 600 | |
| Very negative | 9 | 7 | 4 700 | |
| Can not say | 8 | 12 | 8 000 | Source: NRS 2025 |
| Reading device and advertising effect | All 15+ % | Magazine Readers % | Amount of readers | |
|---|---|---|---|---|
| I relax and get inspired by magazines | Completely agree | 17 | 20 | 13 300 |
| Partially agree | 60 | 63 | 42 000 | |
| Partially disagree | 11 | 8 | 5 300 | |
| Completely disagree | 3 | 3 | 2 000 | |
| Can not say | 9 | 7 | 4 700 | |
| I stop and disconnect from hectic everyday life by reading magazines. | Completely agree | 16 | 15 | 10 000 |
| Partially agree | 57 | 62 | 41 300 | |
| Partially disagree | 14 | 10 | 6 700 | |
| Completely disagree | 5 | 5 | 3 300 | |
| Can not say | 8 | 7 | 4 700 | |
| A professional magazine keeps me up to date on professional matters | Completely agree | 23 | 23 | 15 300 |
| Partially agree | 46 | 38 | 25 300 | |
| Partially disagree | 12 | 10 | 6 700 | |
| Completely disagree | 5 | 6 | 4 000 | |
| Can not say | 15 | 22 | 14 700 | |
| The industry specialty magazine provides information on my hobbies and interests | Completely agree | 31 | 27 | 18 000 |
| Partially agree | 49 | 53 | 35 300 | |
| Partially disagree | 7 | 7 | 4 700 | |
| Completely disagree | 2 | 3 | 2 000 | |
| Can not say | 10 | 11 | 7 300 | |
| Finnish magazines offer reliable comparisons and tests | Completely agree | 16 | 16 | 10 700 |
| Partially agree | 51 | 53 | 35 300 | |
| Partially disagree | 14 | 16 | 10 700 | |
| Completely disagree | 3 | 2 | 1 300 | |
| Can not say | 16 | 14 | 9 300 | |
| Finnish magazines offer reliable product recommendations | Completely agree | 11 | 8 | 5 300 |
| Partially agree | 52 | 56 | 37 300 | |
| Partially disagree | 18 | 18 | 12 000 | |
| Completely disagree | 3 | 2 | 1 300 | |
| Can not say | 17 | 16 | 10 700 | |
| Finnish magazines are of high quality | Completely agree | 23 | 23 | 15 300 |
| Partially agree | 58 | 62 | 41 300 | |
| Partially disagree | 9 | 10 | 6 700 | |
| Completely disagree | 1 | 1 | 700 | |
| Can not say | 9 | 4 | 2 700 | |
| I follow important magazines on social media | Completely agree | 7 | 5 | 3 300 |
| Partially agree | 25 | 33 | 22 000 | |
| Partially disagree | 23 | 21 | 14 000 | |
| Completely disagree | 36 | 29 | 19 300 | |
| Can not say | 10 | 11 | 7 300 | |
| I read important magazines from cover to cover | Completely agree | 16 | 23 | 15 300 |
| Partially agree | 33 | 39 | 26 000 | |
| Partially disagree | 29 | 26 | 17 300 | |
| Completely disagree | 17 | 11 | 7 300 | |
| Can not say | 5 | 2 | 1 300 | |
| Ads in magazines make new things familiar | Completely agree | 7 | 9 | 6 000 |
| Partially agree | 45 | 48 | 32 000 | |
| Partially disagree | 28 | 26 | 17 300 | |
| Completely disagree | 10 | 10 | 6 700 | |
| Can not say | 10 | 7 | 4 700 | |
| I have searched the internet for more information about a product advertised in a magazine | Completely agree | 10 | 12 | 8 000 |
| Partially agree | 35 | 31 | 20 600 | |
| Partially disagree | 23 | 23 | 15 300 | |
| Completely disagree | 23 | 26 | 17 300 | |
| Can not say | 9 | 8 | 5 300 | |
| I have purchased products based on the ad in magazine | Completely agree | 9 | 9 | 6 000 |
| Partially agree | 33 | 34 | 22 600 | |
| Partially disagree | 27 | 24 | 16 000 | |
| Completely disagree | 24 | 28 | 18 600 | |
| Can not say | 8 | 6 | 4 000 | |
| I'm trying out tips or guidelines (like recipes) in magazine ads | Completely agree | 13 | 16 | 10 700 |
| Partially agree | 50 | 51 | 34 000 | |
| Partially disagree | 19 | 17 | 11 300 | |
| Completely disagree | 13 | 12 | 8 000 | |
| Can not say | 5 | 4 | 2 700 | |
| I'm experimenting with product samples in magazines (like food or cosmetics) | Completely agree | 9 | 9 | 6 000 |
| Partially agree | 29 | 33 | 22 000 | |
| Partially disagree | 27 | 28 | 18 600 | |
| Completely disagree | 29 | 27 | 18 000 | |
| Can not say | 7 | 4 | 2 700 | |
| I trust product recommendations from social media influencers | Completely agree | 2 | 2 | 1 300 |
| Partially agree | 18 | 8 | 5 300 | |
| Partially disagree | 33 | 31 | 20 600 | |
| Completely disagree | 38 | 42 | 28 000 | |
| Can not say | 10 | 17 | 11 300 | |
| The free customer magazine is an important customer benefit for me | Completely agree | 16 | 25 | 16 600 |
| Partially agree | 41 | 48 | 32 000 | |
| Partially disagree | 23 | 16 | 10 700 | |
| Completely disagree | 12 | 6 | 4 000 | |
| Can not say | 8 | 5 | 3 300 | Source: NRS 2025 |
| Use of information sources during the purchase process | All 15+ % | Magazine Readers % | Amount of readers | |
|---|---|---|---|---|
| Information sources, cars and car purchase | Print magazines | 11 | 12 | 8 000 |
| Newspapers | 12 | 19 | 12 700 | |
| Magazine websites | 7 | 2 | 1 300 | |
| Newspaper websites | 8 | 7 | 4 700 | |
| Blogs | 3 | 0 | 0 | |
| Social media | 16 | 5 | 3 300 | |
| Other websites | 44 | 29 | 19 300 | |
| Television | 11 | 8 | 5 300 | |
| Radio | 2 | 2 | 1 300 | |
| Direct mail | 10 | 13 | 8 700 | |
| None of these | 39 | 51 | 34 000 | |
| Information sources, consumer electronics and information technology | Print magazines | 13 | 19 | 12 700 |
| Newspapers | 15 | 27 | 18 000 | |
| Magazine websites | 9 | 5 | 3 300 | |
| Newspaper websites | 11 | 10 | 6 700 | |
| Blogs | 6 | 1 | 700 | |
| Social media | 28 | 11 | 7 300 | |
| Other websites | 50 | 34 | 22 600 | |
| Television | 19 | 22 | 14 700 | |
| Radio | 3 | 2 | 1 300 | |
| Direct mail | 35 | 48 | 32 000 | |
| None of these | 16 | 23 | 15 300 | |
| Information sources, beauty care and cosmetics | Print magazines | 18 | 33 | 22 000 |
| Newspapers | 8 | 14 | 9 300 | |
| Magazine websites | 10 | 7 | 4 700 | |
| Newspaper websites | 7 | 6 | 4 000 | |
| Blogs | 7 | 2 | 1 300 | |
| Social media | 31 | 16 | 10 700 | |
| Other websites | 17 | 14 | 9 300 | |
| Television | 14 | 21 | 14 000 | |
| Radio | 2 | 2 | 1 300 | |
| Direct mail | 17 | 31 | 20 600 | |
| None of these | 43 | 41 | 27 300 | |
| Information sources, travel | Print magazines | 16 | 24 | 16 000 |
| Newspapers | 15 | 26 | 17 300 | |
| Magazine websites | 10 | 6 | 4 000 | |
| Newspaper websites | 11 | 11 | 7 300 | |
| Blogs | 12 | 3 | 2 000 | |
| Social media | 38 | 18 | 12 000 | |
| Other websites | 49 | 37 | 24 600 | |
| Television | 17 | 14 | 9 300 | |
| Radio | 3 | 3 | 2 000 | |
| Direct mail | 9 | 17 | 11 300 | |
| None of these | 25 | 30 | 20 000 | |
| Information sources, style and fashion | Print magazines | 22 | 40 | 26 600 |
| Newspapers | 11 | 18 | 12 000 | |
| Magazine websites | 12 | 9 | 6 000 | |
| Newspaper websites | 8 | 8 | 5 300 | |
| Blogs | 9 | 1 | 700 | |
| Social media | 37 | 21 | 14 000 | |
| Other websites | 34 | 29 | 19 300 | |
| Television | 18 | 22 | 14 700 | |
| Radio | 2 | 1 | 700 | |
| Direct mail | 25 | 40 | 26 600 | |
| None of these | 28 | 22 | 14 700 | |
| Information sources, building and renovating | Print magazines | 17 | 24 | 16 000 |
| Newspapers | 13 | 21 | 14 000 | |
| Magazine websites | 9 | 8 | 5 300 | |
| Newspaper websites | 9 | 10 | 6 700 | |
| Blogs | 7 | 2 | 1 300 | |
| Social media | 26 | 12 | 8 000 | |
| Other websites | 33 | 24 | 16 000 | |
| Television | 18 | 15 | 10 000 | |
| Radio | 2 | 1 | 700 | |
| Direct mail | 27 | 35 | 23 300 | |
| None of these | 31 | 37 | 24 600 | |
| Information sources, food, cooking and baking | Print magazines | 35 | 51 | 34 000 |
| Newspapers | 25 | 41 | 27 300 | |
| Magazine websites | 21 | 18 | 12 000 | |
| Newspaper websites | 23 | 15 | 10 000 | |
| Blogs | 14 | 5 | 3 300 | |
| Social media | 45 | 26 | 17 300 | |
| Other websites | 32 | 24 | 16 000 | |
| Television | 29 | 33 | 22 000 | |
| Radio | 7 | 7 | 4 700 | |
| Direct mail | 26 | 41 | 27 300 | |
| None of these | 11 | 9 | 6 000 | |
| Information sources, eyeglasses, contact lenses or sunglasses | Print magazines | 6 | 14 | 9 300 |
| Newspapers | 10 | 20 | 13 300 | |
| Magazine websites | 3 | 2 | 1 300 | |
| Newspaper websites | 5 | 8 | 5 300 | |
| Blogs | 1 | 0 | 0 | |
| Social media | 12 | 7 | 4 700 | |
| Other websites | 27 | 20 | 13 300 | |
| Television | 12 | 15 | 10 000 | |
| Radio | 2 | 2 | 1 300 | |
| Direct mail | 16 | 29 | 19 300 | |
| None of these | 52 | 42 | 28 000 | |
| Information sources, decorating and furniture purchases | Print magazines | 23 | 38 | 25 300 |
| Newspapers | 14 | 23 | 15 300 | |
| Magazine websites | 11 | 8 | 5 300 | |
| Newspaper websites | 9 | 8 | 5 300 | |
| Blogs | 7 | 2 | 1 300 | |
| Social media | 31 | 13 | 8 700 | |
| Other websites | 31 | 17 | 11 300 | |
| Television | 19 | 20 | 13 300 | |
| Radio | 2 | 1 | 700 | |
| Direct mail | 31 | 44 | 29 300 | |
| None of these | 24 | 27 | 18 000 | |
| Information sources, saving and investing | Print magazines | 9 | 11 | 7 300 |
| Newspapers | 11 | 11 | 7 300 | |
| Magazine websites | 6 | 3 | 2 000 | |
| Newspaper websites | 11 | 7 | 4 700 | |
| Blogs | 7 | 1 | 700 | |
| Social media | 22 | 7 | 4 700 | |
| Other websites | 32 | 21 | 14 000 | |
| Television | 8 | 9 | 6 000 | |
| Radio | 3 | 3 | 2 000 | |
| Direct mail | 4 | 7 | 4 700 | |
| None of these | 44 | 57 | 38 000 | |
| Information sources, health and wellbeing products / services | Print magazines | 13 | 24 | 16 000 |
| Newspapers | 13 | 23 | 15 300 | |
| Magazine websites | 8 | 7 | 4 700 | |
| Newspaper websites | 9 | 11 | 7 300 | |
| Blogs | 5 | 0 | 0 | |
| Social media | 26 | 19 | 12 700 | |
| Other websites | 39 | 32 | 21 300 | |
| Television | 13 | 14 | 9 300 | |
| Radio | 3 | 3 | 2 000 | |
| Direct mail | 15 | 23 | 15 300 | |
| None of these | 36 | 30 | 20 000 | |
| Information sources, purchase of sportswear, -footwear or -equipment | Print magazines | 12 | 20 | 13 300 |
| Newspapers | 16 | 27 | 18 000 | |
| Magazine websites | 7 | 5 | 3 300 | |
| Newspaper websites | 9 | 11 | 7 300 | |
| Blogs | 5 | 2 | 1 300 | |
| Social media | 26 | 10 | 6 700 | |
| Other websites | 42 | 25 | 16 600 | |
| Television | 14 | 14 | 9 300 | |
| Radio | 2 | 1 | 700 | |
| Direct mail | 30 | 46 | 30 600 | |
| None of these | 28 | 29 | 19 300 | Source: NRS 2025 |
| Buyer profile | All 15+ % | Magazine Readers % | Amount of readers | |
|---|---|---|---|---|
| Interests | Cars, motor vehicles | 25 | 11 | 7 300 |
| Well-being and health | 50 | 67 | 44 600 | |
| Charity work | 13 | 22 | 14 700 | |
| Self development | 32 | 25 | 16 600 | |
| Celebrities | 14 | 23 | 15 300 | |
| Fishing | 16 | 7 | 4 700 | |
| Beauty care and cosmetics | 16 | 19 | 12 700 | |
| Literature | 27 | 51 | 34 000 | |
| Domestic and foreign news | 52 | 52 | 34 600 | |
| Domestic travel | 32 | 35 | 23 300 | |
| Culture | 33 | 51 | 34 000 | |
| Crafts | 25 | 39 | 26 000 | |
| Nature and going outdoor | 52 | 48 | 32 000 | |
| Hunting | 10 | 1 | 700 | |
| Style and fashion | 20 | 26 | 17 300 | |
| Music and concerts | 36 | 36 | 24 000 | |
| Going on summer cottage | 29 | 23 | 15 300 | |
| Local affairs | 55 | 67 | 44 600 | |
| Computer/console/mobile playing | 17 | 5 | 3 300 | |
| Politics | 42 | 42 | 28 000 | |
| Gardening and plants | 30 | 42 | 28 000 | |
| Building and renovating | 34 | 19 | 12 700 | |
| Food and drink | 38 | 37 | 24 600 | |
| Cooking, baking, recipes | 38 | 51 | 34 000 | |
| Investment | 23 | 20 | 13 300 | |
| Decorating | 28 | 32 | 21 300 | |
| Economic and finances | 35 | 33 | 22 000 | |
| Science | 35 | 19 | 12 700 | |
| Travelling abroad | 34 | 20 | 13 300 | |
| Sports, exercising | 45 | 31 | 20 600 | |
| Sailing, boating | 10 | 1 | 700 | |
| Consumer electronics and information technology | 21 | 6 | 4 000 | |
| Environmental matters | 31 | 28 | 18 600 | |
| None of the above | 0 | 0 | 0 | |
| Purchases made and planned | ||||
| Planned acquisitions in the househould over the next 2 years | Building a house | 2 | 1 | 700 |
| Buying an apartment | 11 | 5 | 3 300 | |
| Home renovation | 27 | 19 | 12 700 | |
| Buying a car | 27 | 16 | 10 700 | |
| Buying a boat | 3 | 2 | 1 300 | |
| None of these | 51 | 68 | 45 300 | |
| Purchases in the last 12 months | Furniture and furnishings | 44 | 29 | 19 300 |
| Repair and construction products | 39 | 29 | 19 300 | |
| Domestic appliances | 38 | 33 | 22 000 | |
| Electronics or IT products | 49 | 27 | 18 000 | |
| Cars | 19 | 13 | 8 700 | |
| Clothing and footwear | 84 | 80 | 53 300 | |
| Eyeglasses, contact lenses or sunglasses | 36 | 39 | 26 000 | |
| Sports clothing, footwear or equipment | 58 | 39 | 26 000 | |
| Saving or investing products or services | 29 | 22 | 14 700 | |
| Cosmetics and beauty products | 49 | 52 | 34 600 | |
| Mobile phones | 29 | 24 | 16 000 | |
| Travels | 50 | 45 | 30 000 | |
| Products and services for health and well-being | 61 | 65 | 43 300 | |
| None of the above | 1 | 2 | 1 300 | |
| Intentions to purchase within 12 months | Furniture and furnishings | 30 | 14 | 9 300 |
| Repair and construction products | 33 | 23 | 15 300 | |
| Domestic appliances | 18 | 15 | 10 000 | |
| Electronics or IT products | 27 | 12 | 8 000 | |
| Cars | 14 | 11 | 7 300 | |
| Clothing and footwear | 67 | 63 | 42 000 | |
| Eyeglasses, contact lenses or sunglasses | 27 | 33 | 22 000 | |
| Sports clothing, footwear or equipment | 44 | 25 | 16 600 | |
| Saving or investing products or services | 24 | 16 | 10 700 | |
| Cosmetics and beauty products | 38 | 41 | 27 300 | |
| Mobile phones | 16 | 9 | 6 000 | |
| Travels | 46 | 33 | 22 000 | |
| Products and services for health and well-being | 49 | 54 | 36 000 | |
| None of the above | 6 | 8 | 5 300 | |
| Will consider switching over the next 12 months | Bank | 7 | 3 | 2 000 |
| Insurance company | 11 | 6 | 4 000 | |
| electric company | 17 | 11 | 7 300 | |
| Internet Connection | 10 | 7 | 4 700 | |
| Phone-subscription | 14 | 9 | 6 000 | |
| None of the above | 48 | 60 | 40 000 | |
| Can not say | 18 | 18 | 12 000 | |
| Uses of extra money | Magazines, books, movies | 16 | 15 | 10 000 |
| Eating, drinking, partying in a restaurant | 35 | 20 | 13 300 | |
| Exercise hobbies and equipment | 28 | 15 | 10 000 | |
| Cultural events (e.g. concerts, theater, festivals) | 36 | 34 | 22 600 | |
| Renovation, decoration | 23 | 20 | 13 300 | |
| Health services and one's own well-being | 22 | 33 | 22 000 | |
| Travelling | 44 | 41 | 27 300 | |
| Entertainment electronics and information technology equipment, mobile phones | 14 | 5 | 3 300 | |
| Clothes, shoes and bags | 22 | 14 | 9 300 | |
| Home services (cleaning and other housekeeping services) | 5 | 14 | 9 300 | |
| Car, boat, motorcycle | 11 | 5 | 3 300 | |
| Cosmetics and beauty care | 12 | 10 | 6 700 | |
| Saving, investing | 49 | 43 | 28 600 | |
| Other | 8 | 10 | 6 700 | |
| There is no extra money after mandatory expenses | 8 | 9 | 6 000 | |
| Can not say | 3 | 6 | 4 000 | Source: NRS 2025 |
The total audience includes those who read printed and digital magazines.
|
Total reach 73 900
Only print
Only print
Print and online
|
Reader profile | All 15+ % | Magazine Readers % | Amount of readers |
|---|---|---|---|---|
| Sex | Women | 51 | 78 | 53 900 |
| Men | 49 | 22 | 12 700 | |
| Native language | Finnish | 95 | 98 | 65 300 |
| Swedish | 5 | 2 | 1 300 | |
| Age | 15-24 y | 13 | 6 | 2 700 |
| 25-34 y | 14 | 2 | 1 300 | |
| 35-44 y | 14 | 4 | 2 000 | |
| 45-54 y | 14 | 3 | 1 300 | |
| 55-64 y | 15 | 8 | 5 300 | |
| 65+ y | 30 | 77 | 54 600 | |
| Gender + age | Female 15-29 years | 9 | 1 | 700 |
| Female 30-49 years | 14 | 3 | 1 300 | |
| Female 50+ years | 28 | 73 | 51 900 | |
| Male 15-29 years | 10 | 6 | 2 700 | |
| Male 30-49 years | 15 | 4 | 2 000 | |
| Male 50+ years | 24 | 13 | 8 700 | |
| Household position | Lives at home with parents | 7 | 5 | 2 000 |
| Lives alone | 29 | 39 | 26 600 | |
| Lives with spouse | 36 | 48 | 32 600 | |
| Lives with spouse and children | 24 | 5 | 2 700 | |
| Single parent | 2 | 1 | 700 | |
| Other | 3 | 2 | 1 300 | |
| Grandchildren under 18 years of age | Yes | 20 | 36 | 25 300 |
| No | 39 | 52 | 36 000 | |
| No answer (under 45 year olds) | 41 | 12 | 5 300 | |
| Education | Elementary school | 4 | 10 | 7 300 |
| Secondary school | 6 | 12 | 8 700 | |
| Vocational | 27 | 29 | 20 000 | |
| High school | 13 | 9 | 6 700 | |
| University of Applied Sciences | 20 | 13 | 8 000 | |
| University | 28 | 21 | 13 300 | |
| Something else | 2 | 5 | 2 700 | |
| Decision-maker in grocery purchases | Yes | 93 | 94 | 63 300 |
| No | 6 | 6 | 3 300 | |
| Can not say | 1 | 1 | 700 | |
| Use of glasses or contact lenses | Yes | 68 | 87 | 59 900 |
| No | 32 | 13 | 6 700 | |
| Size of the household | 1 pers | 28 | 44 | 30 000 |
| 2 pers | 38 | 45 | 30 600 | |
| 3 pers | 14 | 4 | 2 700 | |
| 4 pers | 12 | 3 | 1 300 | |
| 5+ pers | 7 | 4 | 1 300 | |
| Household income (gross) | Below 20 000 € /y | 10 | 10 | 6 700 |
| 20 000 - 35 000 € /y | 17 | 33 | 23 300 | |
| 35 001 - 50 000 € /y | 18 | 25 | 17 300 | |
| 50 001 - 85 000 € /y | 21 | 11 | 7 300 | |
| 85 001 - 100 000 € /y | 8 | 3 | 2 000 | |
| Over 100 000 € /y | 10 | 3 | 1 300 | |
| Dont want to tell | 5 | 6 | 4 000 | |
| Cant say / No answer | 10 | 9 | 4 700 | |
| Family with kids | Yes | 32 | 9 | 4 700 |
| No | 68 | 91 | 61 900 | |
| Number of children in the household (5th grade) | 1 child | 13 | 4 | 2 700 |
| 2 children | 13 | 2 | 700 | |
| 3 children | 5 | 2 | 700 | |
| 4 children | 1 | 0 | 0 | |
| 5+ children | 1 | 1 | 700 | |
| There are no children | 67 | 90 | 61 900 | |
| Doesn't want to answer | 0 | 0 | 0 | |
| Pets in household | Cat | 16 | 13 | 8 700 |
| Dog | 26 | 14 | 8 700 | |
| Some other pet | 5 | 2 | 1 300 | |
| No pets | 61 | 73 | 49 300 | |
| Health services used in the household | Public health services | 85 | 91 | 61 300 |
| Employer - funded health care services | 50 | 18 | 10 000 | |
| Private, self-funded healthcare services | 39 | 50 | 34 000 | |
| Private health insurance services | 26 | 13 | 8 700 | |
| No health care | 1 | 0 | 0 | |
| Can not say | 1 | 1 | 700 | |
| Housing | Apartment | 32 | 37 | 24 600 |
| Row house or semi-detached house | 17 | 16 | 10 700 | |
| Detached house | 46 | 41 | 26 600 | |
| Farm | 4 | 4 | 2 700 | |
| Something else | 1 | 2 | 1 300 | |
| Can not say | 0 | 0 | 0 | |
| Ownership of housing | Owner-occupied residence | 76 | 82 | 54 600 |
| Rented residence | 20 | 15 | 9 300 | |
| Right of residence apartment | 2 | 2 | 1 300 | |
| Something else | 1 | 1 | 700 | |
| Can not say | 1 | 1 | 700 | |
| Cottage or holiday home in regular use | Yes | 41 | 46 | 30 600 |
| No | 58 | 54 | 36 000 | |
| Can not say | 1 | 1 | 700 | |
| Number of cars in household | One car | 45 | 52 | 35 300 |
| Two cars | 30 | 24 | 15 300 | |
| Three or more cars | 10 | 4 | 2 700 | |
| No car | 14 | 20 | 13 300 | |
| Type of car, if buying now | New | 21 | 21 | 14 700 |
| Used | 70 | 55 | 37 300 | |
| Company car | 5 | 1 | 700 | |
| Leasing (personal) | 9 | 6 | 3 300 | |
| Shared car | 3 | 2 | 1 300 | |
| Doesn't use a car | 8 | 18 | 12 000 | |
| Can not say | 5 | 8 | 4 700 | |
| Advertising ban at the door / mailbox | Yes | 27 | 15 | 9 300 |
| No | 72 | 84 | 57 300 | |
| Can not say | 1 | 0 | 700 | |
| Using AdBlocker or similar application | Yes | 19 | 7 | 3 300 |
| No | 76 | 85 | 58 600 | |
| Can not say | 5 | 7 | 4 700 | |
| Type of municipality (7 class) | Greater Helsinki | 19 | 13 | 7 300 |
| Turku or Tampere | 8 | 9 | 5 300 | |
| Oulu | 4 | 6 | 4 000 | |
| 70 000 - 150 000 inhabitants town | 14 | 18 | 11 300 | |
| Urban municipality | 25 | 25 | 17 300 | |
| Conurbation | 16 | 14 | 10 000 | |
| Countryside | 13 | 16 | 11 300 | Source: NRS 2025 |
| How often different content is read | All 15+ % | Magazine Readers % | Amount of readers | |
|---|---|---|---|---|
| The frequency of reading: Print magazines | Daily | 12 | 33 | 24 000 |
| 5-6 days a week | 4 | 9 | 6 000 | |
| 1-4 days a week | 24 | 35 | 24 000 | |
| Monthly | 25 | 10 | 6 000 | |
| Rarely | 26 | 7 | 3 300 | |
| Never | 8 | 5 | 3 300 | |
| Can not say | 1 | 1 | 700 | |
| The frequency of reading: Magazine content in digital format | Daily | 23 | 17 | 10 700 |
| 5-6 days a week | 5 | 10 | 6 000 | |
| 1-4 days a week | 20 | 15 | 10 000 | |
| Monthly | 15 | 8 | 4 700 | |
| Rarely | 23 | 23 | 16 000 | |
| Never | 13 | 23 | 16 600 | |
| Can not say | 1 | 3 | 2 700 | |
| The frequency of reading: Print newspapers or afternoon papers | Daily | 25 | 60 | 43 300 |
| 5-6 days a week | 5 | 5 | 3 300 | |
| 1-4 days a week | 23 | 18 | 11 300 | |
| Monthly | 15 | 5 | 2 700 | |
| Rarely | 24 | 8 | 4 700 | |
| Never | 8 | 3 | 1 300 | |
| Can not say | 1 | 0 | 0 | |
| The frequency of reading: Newspaper or afternoon paper content in digital format | Daily | 54 | 44 | 28 600 |
| 5-6 days a week | 9 | 7 | 4 700 | |
| 1-4 days a week | 17 | 17 | 10 700 | |
| Monthly | 6 | 4 | 2 000 | |
| Rarely | 8 | 12 | 8 700 | |
| Never | 5 | 17 | 12 700 | |
| Can not say | 0 | 0 | 0 | |
| The frequency of reading: Free and free delivery newspapers | Daily | 4 | 6 | 4 700 |
| 5-6 days a week | 4 | 8 | 5 300 | |
| 1-4 days a week | 41 | 54 | 37 300 | |
| Monthly | 18 | 13 | 8 700 | |
| Rarely | 23 | 15 | 8 700 | |
| Never | 9 | 3 | 2 000 | |
| Can not say | 1 | 1 | 0 | |
| The frequency of watching: Free online TV services | Daily | 17 | 20 | 14 000 |
| 5-6 days a week | 10 | 9 | 6 000 | |
| 1-4 days a week | 30 | 25 | 16 600 | |
| Monthly | 21 | 19 | 12 000 | |
| Rarely | 15 | 13 | 8 700 | |
| Never | 6 | 12 | 8 700 | |
| Can not say | 1 | 1 | 700 | |
| The frequency of watching: Pay TV and streaming services | Daily | 15 | 8 | 5 300 |
| 5-6 days a week | 10 | 6 | 3 300 | |
| 1-4 days a week | 22 | 12 | 7 300 | |
| Monthly | 9 | 8 | 4 700 | |
| Rarely | 13 | 13 | 8 700 | |
| Never | 30 | 52 | 36 600 | |
| Can not say | 1 | 1 | 700 | |
| The frequency of watching: Programs of YLE (national broadcaster) TV channels | Daily | 44 | 67 | 47 300 |
| 5-6 days a week | 10 | 10 | 6 000 | |
| 1-4 days a week | 19 | 11 | 6 000 | |
| Monthly | 12 | 4 | 2 700 | |
| Rarely | 12 | 6 | 4 000 | |
| Never | 3 | 1 | 700 | |
| Can not say | 0 | 1 | 0 | |
| The frequency of watching: Programs of commercial TV channels | Daily | 33 | 47 | 32 600 |
| 5-6 days a week | 12 | 10 | 6 000 | |
| 1-4 days a week | 22 | 20 | 12 700 | |
| Monthly | 12 | 6 | 3 300 | |
| Rarely | 13 | 7 | 4 700 | |
| Never | 8 | 9 | 6 700 | |
| Can not say | 0 | 1 | 700 | |
| The frequency of listening: Programs of YLE (national broadcaster) radio-channels | Daily | 21 | 36 | 25 300 |
| 5-6 days a week | 6 | 7 | 4 700 | |
| 1-4 days a week | 16 | 15 | 10 000 | |
| Monthly | 13 | 10 | 6 000 | |
| Rarely | 27 | 20 | 12 700 | |
| Never | 15 | 11 | 7 300 | |
| Can not say | 1 | 1 | 700 | |
| The frequency of listening: Programs of commercial radio channels | Daily | 16 | 11 | 7 300 |
| 5-6 days a week | 9 | 6 | 3 300 | |
| 1-4 days a week | 21 | 16 | 10 700 | |
| Monthly | 14 | 12 | 8 000 | |
| Rarely | 23 | 22 | 14 700 | |
| Never | 16 | 30 | 20 600 | |
| Can not say | 1 | 2 | 1 300 | |
| The frequency of listening: Podcasts | Daily | 6 | 2 | 1 300 |
| 5-6 days a week | 3 | 2 | 1 300 | |
| 1-4 days a week | 11 | 6 | 3 300 | |
| Monthly | 14 | 8 | 4 000 | |
| Rarely | 27 | 29 | 19 300 | |
| Never | 36 | 49 | 34 000 | |
| Can not say | 2 | 5 | 3 300 | |
| User frequency and following: Social media | Daily | 59 | 49 | 31 300 |
| 5-6 days a week | 8 | 6 | 4 000 | |
| 1-4 days a week | 8 | 8 | 5 300 | |
| Monthly | 3 | 4 | 2 700 | |
| Rarely | 6 | 6 | 4 000 | |
| Never | 16 | 25 | 17 300 | |
| Can not say | 0 | 2 | 1 300 | |
| User frequency and following: Bloggers, YouTubers, or social media influencers | Daily | 14 | 9 | 4 700 |
| 5-6 days a week | 6 | 2 | 1 300 | |
| 1-4 days a week | 13 | 9 | 5 300 | |
| Monthly | 8 | 6 | 3 300 | |
| Rarely | 20 | 21 | 13 300 | |
| Never | 38 | 53 | 37 300 | |
| Can not say | 1 | 1 | 700 | |
| User frequency: Instant messaging | Daily | 69 | 50 | 32 000 |
| 5-6 days a week | 11 | 14 | 10 000 | |
| 1-4 days a week | 9 | 16 | 11 300 | |
| Monthly | 3 | 4 | 3 300 | |
| Rarely | 2 | 3 | 2 000 | |
| Never | 6 | 10 | 6 700 | |
| Can not say | 0 | 2 | 1 300 | |
| Reading frequency: Printed books | Daily | 16 | 31 | 21 300 |
| 5-6 days a week | 6 | 7 | 5 300 | |
| 1-4 days a week | 14 | 17 | 11 300 | |
| Monthly | 22 | 20 | 12 700 | |
| Rarely | 34 | 20 | 12 700 | |
| Never | 7 | 4 | 2 700 | |
| Can not say | 1 | 0 | 0 | |
| Reading frequency: E-books | Daily | 3 | 3 | 2 000 |
| 5-6 days a week | 1 | 1 | 700 | |
| 1-4 days a week | 4 | 3 | 2 000 | |
| Monthly | 7 | 4 | 2 700 | |
| Rarely | 30 | 21 | 14 000 | |
| Never | 53 | 66 | 45 300 | |
| Can not say | 1 | 1 | 700 | |
| Listening frequency: Audiobooks | Daily | 6 | 5 | 3 300 |
| 5-6 days a week | 3 | 2 | 1 300 | |
| 1-4 days a week | 6 | 4 | 2 700 | |
| Monthly | 8 | 6 | 3 300 | |
| Rarely | 23 | 16 | 10 700 | |
| Never | 54 | 66 | 44 600 | |
| Can not say | 1 | 1 | 700 | |
| Usage/viewing frequency: YouTube | Daily | 19 | 11 | 6 700 |
| 5-6 days a week | 9 | 6 | 4 000 | |
| 1-4 days a week | 23 | 18 | 11 300 | |
| Monthly | 21 | 20 | 13 300 | |
| Rarely | 17 | 23 | 16 000 | |
| Never | 10 | 21 | 14 700 | |
| Can not say | 0 | 1 | 700 | |
| Usage/following: Linkedl | Daily | 4 | 1 | 700 |
| 5-6 days a week | 2 | 1 | 700 | |
| 1-4 days a week | 8 | 3 | 1 300 | |
| Monthly | 8 | 3 | 1 300 | |
| Rarely | 12 | 9 | 6 000 | |
| Never | 59 | 69 | 47 300 | |
| Cant say / No answer | 6 | 13 | 9 300 | |
| Usage/following: Facebook | Daily | 39 | 39 | 26 600 |
| 5-6 days a week | 8 | 8 | 6 000 | |
| 1-4 days a week | 11 | 7 | 4 700 | |
| Monthly | 6 | 4 | 2 700 | |
| Rarely | 9 | 6 | 4 000 | |
| Never | 22 | 25 | 16 600 | |
| Cant say / No answer | 4 | 10 | 6 700 | |
| Usage/Following: Instagram | Daily | 32 | 18 | 10 700 |
| 5-6 days a week | 7 | 7 | 3 300 | |
| 1-4 days a week | 9 | 8 | 5 300 | |
| Monthly | 5 | 4 | 2 700 | |
| Rarely | 9 | 10 | 6 700 | |
| Never | 33 | 43 | 30 600 | |
| Cant say / No answer | 5 | 10 | 6 700 | |
| Usage/following rate: Snapchat | Daily | 15 | 5 | 2 000 |
| 5-6 days a week | 2 | 1 | 700 | |
| 1-4 days a week | 3 | 1 | 700 | |
| Monthly | 2 | 0 | 0 | |
| Rarely | 5 | 4 | 2 700 | |
| Never | 69 | 77 | 51 900 | |
| Cant say / No answer | 5 | 12 | 8 000 | |
| Usage/Following: Twitter | Daily | 5 | 4 | 2 700 |
| 5-6 days a week | 2 | 1 | 700 | |
| 1-4 days a week | 4 | 2 | 700 | |
| Monthly | 5 | 2 | 1 300 | |
| Rarely | 11 | 7 | 4 000 | |
| Never | 68 | 72 | 50 000 | |
| Cant say / No answer | 5 | 12 | 8 000 | |
| Usage/Following: TikTok | Daily | 10 | 3 | 2 000 |
| 5-6 days a week | 3 | 1 | 700 | |
| 1-4 days a week | 4 | 3 | 2 000 | |
| Monthly | 3 | 2 | 1 300 | |
| Rarely | 8 | 7 | 4 700 | |
| Never | 68 | 73 | 49 300 | |
| Cant say / No answer | 4 | 11 | 6 700 | Source: NRS 2025 |
| Consumer claims | All 15+ % | Magazine Readers % | Amount of readers | |
|---|---|---|---|---|
| I enjoy shopping | Completely agree | 14 | 12 | 8 000 |
| Partially agree | 43 | 40 | 26 000 | |
| Partially disagree | 30 | 34 | 23 300 | |
| Completely disagree | 10 | 11 | 7 300 | |
| Can not say | 3 | 4 | 2 000 | |
| I prefer domestic products | Completely agree | 33 | 41 | 27 300 |
| Partially agree | 55 | 51 | 34 000 | |
| Partially disagree | 9 | 6 | 3 300 | |
| Completely disagree | 1 | 0 | 0 | |
| Can not say | 2 | 2 | 1 300 | |
| I consciously make responsible choices in my consumption | Completely agree | 20 | 28 | 18 600 |
| Partially agree | 54 | 56 | 37 300 | |
| Partially disagree | 18 | 11 | 7 300 | |
| Completely disagree | 4 | 2 | 1 300 | |
| Can not say | 3 | 4 | 2 700 | |
| When shopping, quality is more important to me than price | Completely agree | 23 | 25 | 16 000 |
| Partially agree | 58 | 59 | 39 300 | |
| Partially disagree | 15 | 13 | 8 700 | |
| Completely disagree | 1 | 1 | 700 | |
| Can not say | 2 | 3 | 2 000 | |
| I usually choose the cheapest option | Completely agree | 12 | 9 | 6 000 |
| Partially agree | 48 | 53 | 36 000 | |
| Partially disagree | 33 | 31 | 19 300 | |
| Completely disagree | 5 | 5 | 4 000 | |
| Can not say | 2 | 2 | 1 300 | |
| I often take advantage of discount and campaign prices in my purchases | Completely agree | 37 | 40 | 26 600 |
| Partially agree | 50 | 50 | 32 600 | |
| Partially disagree | 9 | 7 | 5 300 | |
| Completely disagree | 2 | 2 | 2 000 | |
| Can not say | 1 | 0 | 0 | |
| In my circle of friends, I am often the first to try new things | Completely agree | 6 | 5 | 3 300 |
| Partially agree | 24 | 13 | 8 700 | |
| Partially disagree | 38 | 44 | 30 000 | |
| Completely disagree | 24 | 24 | 15 300 | |
| Can not say | 9 | 14 | 9 300 | |
| In my opinion, money is for consumption and not for saving | Completely agree | 5 | 5 | 2 700 |
| Partially agree | 36 | 34 | 22 000 | |
| Partially disagree | 45 | 46 | 31 300 | |
| Completely disagree | 11 | 13 | 8 700 | |
| Can not say | 4 | 2 | 1 300 | |
| I prefer local shops and services | Completely agree | 27 | 39 | 26 600 |
| Partially agree | 58 | 55 | 36 600 | |
| Partially disagree | 11 | 4 | 2 700 | |
| Completely disagree | 1 | 0 | 0 | |
| Can not say | 2 | 1 | 700 | |
| I want to see advertising targeted to me based on my online behavior | Completely agree | 4 | 3 | 2 000 |
| Partially agree | 28 | 24 | 16 000 | |
| Partially disagree | 29 | 24 | 16 600 | |
| Completely disagree | 32 | 36 | 23 300 | |
| Can not say | 7 | 13 | 8 700 | |
| When I want a certain brand of product, the price doesn't matter | Completely agree | 9 | 10 | 6 700 |
| Partially agree | 32 | 31 | 20 600 | |
| Partially disagree | 37 | 41 | 26 600 | |
| Completely disagree | 20 | 16 | 10 700 | |
| Can not say | 2 | 2 | 2 000 | |
| I prefer certified products in my purchases (e.g. Fairtrade, The Nordic Swan Ecolabel, Avainlippu) | Completely agree | 16 | 20 | 14 000 |
| Partially agree | 50 | 56 | 37 300 | |
| Partially disagree | 24 | 18 | 12 000 | |
| Completely disagree | 6 | 2 | 1 300 | |
| Can not say | 4 | 3 | 2 000 | |
| Ecology is an important purchase reason for me | Completely agree | 17 | 19 | 12 700 |
| Partially agree | 51 | 57 | 38 000 | |
| Partially disagree | 22 | 17 | 11 300 | |
| Completely disagree | 6 | 3 | 1 300 | |
| Can not say | 3 | 4 | 2 700 | |
| I prefer well-known brands | Completely agree | 12 | 8 | 5 300 |
| Partially agree | 58 | 56 | 38 000 | |
| Partially disagree | 21 | 22 | 14 700 | |
| Completely disagree | 5 | 7 | 5 300 | |
| Can not say | 3 | 6 | 3 300 | |
| I prefer used products in my purchases | Completely agree | 14 | 11 | 7 300 |
| Partially agree | 41 | 38 | 26 000 | |
| Partially disagree | 31 | 34 | 22 000 | |
| Completely disagree | 12 | 14 | 9 300 | |
| Can not say | 3 | 3 | 2 000 | Source: NRS 2025 |
| Attitude towards advertising in different media channels | All 15+ % | Magazine Readers % | Amount of readers | |
|---|---|---|---|---|
| Newspapers | Very positive | 13 | 15 | 10 000 |
| Quite positively | 61 | 64 | 43 300 | |
| Quite negatively | 16 | 14 | 8 700 | |
| Very negative | 4 | 2 | 1 300 | |
| Can not say | 6 | 4 | 3 300 | |
| Magazines | Very positive | 13 | 13 | 8 700 |
| Quite positively | 60 | 61 | 41 300 | |
| Quite negatively | 17 | 18 | 11 300 | |
| Very negative | 4 | 2 | 1 300 | |
| Can not say | 6 | 5 | 3 300 | |
| Free and local newspapers | Very positive | 24 | 27 | 18 000 |
| Quite positively | 56 | 56 | 37 300 | |
| Quite negatively | 11 | 11 | 6 700 | |
| Very negative | 4 | 1 | 700 | |
| Can not say | 6 | 5 | 3 300 | |
| Newspaper/Magazine websites or applications | Very positive | 7 | 7 | 5 300 |
| Quite positively | 45 | 42 | 28 600 | |
| Quite negatively | 30 | 28 | 16 600 | |
| Very negative | 10 | 6 | 4 000 | |
| Can not say | 8 | 17 | 12 000 | |
| Social media (Facebook, Instagram etc.) | Very positive | 6 | 3 | 2 000 |
| Quite positively | 33 | 34 | 22 600 | |
| Quite negatively | 32 | 28 | 18 000 | |
| Very negative | 17 | 14 | 9 300 | |
| Can not say | 12 | 21 | 14 700 | |
| Blogs | Very positive | 4 | 2 | 1 300 |
| Quite positively | 25 | 16 | 10 700 | |
| Quite negatively | 29 | 23 | 14 000 | |
| Very negative | 16 | 17 | 11 300 | |
| Can not say | 26 | 43 | 30 000 | |
| Newsletters to email | Very positive | 2 | 1 | 700 |
| Quite positively | 17 | 17 | 12 000 | |
| Quite negatively | 34 | 40 | 26 600 | |
| Very negative | 43 | 36 | 24 000 | |
| Can not say | 4 | 5 | 3 300 | |
| Other websites | Very positive | 3 | 1 | 700 |
| Quite positively | 38 | 31 | 20 000 | |
| Quite negatively | 34 | 36 | 23 300 | |
| Very negative | 14 | 14 | 10 000 | |
| Can not say | 11 | 18 | 12 700 | |
| Commercial TV channels (MTV3, Nelonen, Sub, FOX etc.) | Very positive | 7 | 5 | 3 300 |
| Quite positively | 46 | 43 | 28 600 | |
| Quite negatively | 29 | 35 | 23 300 | |
| Very negative | 13 | 11 | 7 300 | |
| Can not say | 4 | 5 | 4 000 | |
| Commercial radio channels (Radio Nova, SuomiPOP, NRJ, Iskelmä etc.) | Very positive | 4 | 2 | 1 300 |
| Quite positively | 35 | 30 | 20 000 | |
| Quite negatively | 33 | 35 | 23 300 | |
| Very negative | 20 | 23 | 15 300 | |
| Can not say | 7 | 11 | 7 300 | |
| Home delivered advertisements and catalogues | Very positive | 19 | 21 | 14 700 |
| Quite positively | 46 | 52 | 34 600 | |
| Quite negatively | 17 | 14 | 9 300 | |
| Very negative | 14 | 9 | 5 300 | |
| Can not say | 5 | 4 | 2 700 | |
| Out-of-home advertising | Very positive | 11 | 5 | 2 700 |
| Quite positively | 52 | 50 | 32 600 | |
| Quite negatively | 21 | 27 | 18 600 | |
| Very negative | 9 | 7 | 4 700 | |
| Can not say | 8 | 12 | 8 000 | Source: NRS 2025 |
| Reading device and advertising effect | All 15+ % | Magazine Readers % | Amount of readers | |
|---|---|---|---|---|
| I relax and get inspired by magazines | Completely agree | 17 | 19 | 13 300 |
| Partially agree | 60 | 63 | 42 000 | |
| Partially disagree | 11 | 8 | 5 300 | |
| Completely disagree | 3 | 3 | 2 000 | |
| Can not say | 9 | 8 | 4 700 | |
| I stop and disconnect from hectic everyday life by reading magazines. | Completely agree | 16 | 15 | 10 000 |
| Partially agree | 57 | 62 | 41 300 | |
| Partially disagree | 14 | 10 | 6 700 | |
| Completely disagree | 5 | 5 | 3 300 | |
| Can not say | 8 | 8 | 4 700 | |
| A professional magazine keeps me up to date on professional matters | Completely agree | 23 | 23 | 15 300 |
| Partially agree | 46 | 38 | 25 300 | |
| Partially disagree | 12 | 10 | 6 700 | |
| Completely disagree | 5 | 6 | 4 000 | |
| Can not say | 15 | 23 | 14 700 | |
| The industry specialty magazine provides information on my hobbies and interests | Completely agree | 31 | 29 | 18 000 |
| Partially agree | 49 | 51 | 35 300 | |
| Partially disagree | 7 | 7 | 4 700 | |
| Completely disagree | 2 | 2 | 2 000 | |
| Can not say | 10 | 11 | 7 300 | |
| Finnish magazines offer reliable comparisons and tests | Completely agree | 16 | 16 | 10 700 |
| Partially agree | 51 | 52 | 35 300 | |
| Partially disagree | 14 | 16 | 10 700 | |
| Completely disagree | 3 | 2 | 1 300 | |
| Can not say | 16 | 14 | 9 300 | |
| Finnish magazines offer reliable product recommendations | Completely agree | 11 | 9 | 5 300 |
| Partially agree | 52 | 55 | 37 300 | |
| Partially disagree | 18 | 18 | 12 000 | |
| Completely disagree | 3 | 2 | 1 300 | |
| Can not say | 17 | 16 | 10 700 | |
| Finnish magazines are of high quality | Completely agree | 23 | 25 | 15 300 |
| Partially agree | 58 | 60 | 41 300 | |
| Partially disagree | 9 | 9 | 6 700 | |
| Completely disagree | 1 | 1 | 700 | |
| Can not say | 9 | 4 | 2 700 | |
| I follow important magazines on social media | Completely agree | 7 | 5 | 3 300 |
| Partially agree | 25 | 33 | 22 000 | |
| Partially disagree | 23 | 21 | 14 000 | |
| Completely disagree | 36 | 29 | 19 300 | |
| Can not say | 10 | 11 | 7 300 | |
| I read important magazines from cover to cover | Completely agree | 16 | 23 | 15 300 |
| Partially agree | 33 | 38 | 26 000 | |
| Partially disagree | 29 | 26 | 17 300 | |
| Completely disagree | 17 | 11 | 7 300 | |
| Can not say | 5 | 2 | 1 300 | |
| Ads in magazines make new things familiar | Completely agree | 7 | 9 | 6 000 |
| Partially agree | 45 | 46 | 32 000 | |
| Partially disagree | 28 | 27 | 17 300 | |
| Completely disagree | 10 | 11 | 6 700 | |
| Can not say | 10 | 7 | 4 700 | |
| I have searched the internet for more information about a product advertised in a magazine | Completely agree | 10 | 13 | 8 000 |
| Partially agree | 35 | 31 | 20 600 | |
| Partially disagree | 23 | 23 | 15 300 | |
| Completely disagree | 23 | 26 | 17 300 | |
| Can not say | 9 | 8 | 5 300 | |
| I have purchased products based on the ad in magazine | Completely agree | 9 | 8 | 6 000 |
| Partially agree | 33 | 34 | 22 600 | |
| Partially disagree | 27 | 24 | 16 000 | |
| Completely disagree | 24 | 28 | 18 600 | |
| Can not say | 8 | 6 | 4 000 | |
| I'm trying out tips or guidelines (like recipes) in magazine ads | Completely agree | 13 | 15 | 10 700 |
| Partially agree | 50 | 51 | 34 000 | |
| Partially disagree | 19 | 17 | 11 300 | |
| Completely disagree | 13 | 13 | 8 000 | |
| Can not say | 5 | 4 | 2 700 | |
| I'm experimenting with product samples in magazines (like food or cosmetics) | Completely agree | 9 | 8 | 6 000 |
| Partially agree | 29 | 32 | 22 000 | |
| Partially disagree | 27 | 28 | 18 600 | |
| Completely disagree | 29 | 28 | 18 000 | |
| Can not say | 7 | 4 | 2 700 | |
| I trust product recommendations from social media influencers | Completely agree | 2 | 2 | 1 300 |
| Partially agree | 18 | 9 | 5 300 | |
| Partially disagree | 33 | 32 | 20 600 | |
| Completely disagree | 38 | 41 | 28 000 | |
| Can not say | 10 | 16 | 11 300 | |
| The free customer magazine is an important customer benefit for me | Completely agree | 16 | 24 | 16 600 |
| Partially agree | 41 | 47 | 32 000 | |
| Partially disagree | 23 | 17 | 10 700 | |
| Completely disagree | 12 | 6 | 4 000 | |
| Can not say | 8 | 5 | 3 300 | Source: NRS 2025 |
| Use of information sources during the purchase process | All 15+ % | Magazine Readers % | Amount of readers | |
|---|---|---|---|---|
| Information sources, cars and car purchase | Print magazines | 11 | 11 | 8 000 |
| Newspapers | 12 | 18 | 12 700 | |
| Magazine websites | 7 | 2 | 1 300 | |
| Newspaper websites | 8 | 7 | 4 700 | |
| Blogs | 3 | 1 | 0 | |
| Social media | 16 | 6 | 3 300 | |
| Other websites | 44 | 29 | 19 300 | |
| Television | 11 | 8 | 5 300 | |
| Radio | 2 | 2 | 1 300 | |
| Direct mail | 10 | 13 | 8 700 | |
| None of these | 39 | 51 | 34 000 | |
| Information sources, consumer electronics and information technology | Print magazines | 13 | 19 | 12 700 |
| Newspapers | 15 | 27 | 18 000 | |
| Magazine websites | 9 | 7 | 3 300 | |
| Newspaper websites | 11 | 12 | 6 700 | |
| Blogs | 6 | 1 | 700 | |
| Social media | 28 | 12 | 7 300 | |
| Other websites | 50 | 35 | 22 600 | |
| Television | 19 | 21 | 14 700 | |
| Radio | 3 | 1 | 1 300 | |
| Direct mail | 35 | 48 | 32 000 | |
| None of these | 16 | 23 | 15 300 | |
| Information sources, beauty care and cosmetics | Print magazines | 18 | 31 | 22 000 |
| Newspapers | 8 | 13 | 9 300 | |
| Magazine websites | 10 | 8 | 4 700 | |
| Newspaper websites | 7 | 6 | 4 000 | |
| Blogs | 7 | 2 | 1 300 | |
| Social media | 31 | 17 | 10 700 | |
| Other websites | 17 | 15 | 9 300 | |
| Television | 14 | 20 | 14 000 | |
| Radio | 2 | 2 | 1 300 | |
| Direct mail | 17 | 29 | 20 600 | |
| None of these | 43 | 42 | 27 300 | |
| Information sources, travel | Print magazines | 16 | 23 | 16 000 |
| Newspapers | 15 | 25 | 17 300 | |
| Magazine websites | 10 | 6 | 4 000 | |
| Newspaper websites | 11 | 12 | 7 300 | |
| Blogs | 12 | 5 | 2 000 | |
| Social media | 38 | 21 | 12 000 | |
| Other websites | 49 | 38 | 24 600 | |
| Television | 17 | 14 | 9 300 | |
| Radio | 3 | 3 | 2 000 | |
| Direct mail | 9 | 17 | 11 300 | |
| None of these | 25 | 30 | 20 000 | |
| Information sources, style and fashion | Print magazines | 22 | 37 | 26 600 |
| Newspapers | 11 | 17 | 12 000 | |
| Magazine websites | 12 | 10 | 6 000 | |
| Newspaper websites | 8 | 9 | 5 300 | |
| Blogs | 9 | 2 | 700 | |
| Social media | 37 | 22 | 14 000 | |
| Other websites | 34 | 30 | 19 300 | |
| Television | 18 | 22 | 14 700 | |
| Radio | 2 | 2 | 700 | |
| Direct mail | 25 | 40 | 26 600 | |
| None of these | 28 | 22 | 14 700 | |
| Information sources, building and renovating | Print magazines | 17 | 23 | 16 000 |
| Newspapers | 13 | 20 | 14 000 | |
| Magazine websites | 9 | 8 | 5 300 | |
| Newspaper websites | 9 | 10 | 6 700 | |
| Blogs | 7 | 2 | 1 300 | |
| Social media | 26 | 13 | 8 000 | |
| Other websites | 33 | 24 | 16 000 | |
| Television | 18 | 15 | 10 000 | |
| Radio | 2 | 2 | 700 | |
| Direct mail | 27 | 34 | 23 300 | |
| None of these | 31 | 38 | 24 600 | |
| Information sources, food, cooking and baking | Print magazines | 35 | 49 | 34 000 |
| Newspapers | 25 | 39 | 27 300 | |
| Magazine websites | 21 | 18 | 12 000 | |
| Newspaper websites | 23 | 16 | 10 000 | |
| Blogs | 14 | 6 | 3 300 | |
| Social media | 45 | 27 | 17 300 | |
| Other websites | 32 | 26 | 16 000 | |
| Television | 29 | 32 | 22 000 | |
| Radio | 7 | 7 | 4 700 | |
| Direct mail | 26 | 40 | 27 300 | |
| None of these | 11 | 10 | 6 000 | |
| Information sources, eyeglasses, contact lenses or sunglasses | Print magazines | 6 | 14 | 9 300 |
| Newspapers | 10 | 19 | 13 300 | |
| Magazine websites | 3 | 2 | 1 300 | |
| Newspaper websites | 5 | 8 | 5 300 | |
| Blogs | 1 | 1 | 0 | |
| Social media | 12 | 7 | 4 700 | |
| Other websites | 27 | 20 | 13 300 | |
| Television | 12 | 14 | 10 000 | |
| Radio | 2 | 2 | 1 300 | |
| Direct mail | 16 | 28 | 19 300 | |
| None of these | 52 | 43 | 28 000 | |
| Information sources, decorating and furniture purchases | Print magazines | 23 | 36 | 25 300 |
| Newspapers | 14 | 21 | 15 300 | |
| Magazine websites | 11 | 8 | 5 300 | |
| Newspaper websites | 9 | 8 | 5 300 | |
| Blogs | 7 | 3 | 1 300 | |
| Social media | 31 | 14 | 8 700 | |
| Other websites | 31 | 18 | 11 300 | |
| Television | 19 | 19 | 13 300 | |
| Radio | 2 | 1 | 700 | |
| Direct mail | 31 | 43 | 29 300 | |
| None of these | 24 | 27 | 18 000 | |
| Information sources, saving and investing | Print magazines | 9 | 11 | 7 300 |
| Newspapers | 11 | 11 | 7 300 | |
| Magazine websites | 6 | 4 | 2 000 | |
| Newspaper websites | 11 | 8 | 4 700 | |
| Blogs | 7 | 2 | 700 | |
| Social media | 22 | 10 | 4 700 | |
| Other websites | 32 | 23 | 14 000 | |
| Television | 8 | 8 | 6 000 | |
| Radio | 3 | 2 | 2 000 | |
| Direct mail | 4 | 7 | 4 700 | |
| None of these | 44 | 55 | 38 000 | |
| Information sources, health and wellbeing products / services | Print magazines | 13 | 23 | 16 000 |
| Newspapers | 13 | 23 | 15 300 | |
| Magazine websites | 8 | 7 | 4 700 | |
| Newspaper websites | 9 | 11 | 7 300 | |
| Blogs | 5 | 1 | 0 | |
| Social media | 26 | 19 | 12 700 | |
| Other websites | 39 | 32 | 21 300 | |
| Television | 13 | 14 | 9 300 | |
| Radio | 3 | 3 | 2 000 | |
| Direct mail | 15 | 23 | 15 300 | |
| None of these | 36 | 31 | 20 000 | |
| Information sources, purchase of sportswear, -footwear or -equipment | Print magazines | 12 | 19 | 13 300 |
| Newspapers | 16 | 26 | 18 000 | |
| Magazine websites | 7 | 6 | 3 300 | |
| Newspaper websites | 9 | 12 | 7 300 | |
| Blogs | 5 | 3 | 1 300 | |
| Social media | 26 | 11 | 6 700 | |
| Other websites | 42 | 26 | 16 600 | |
| Television | 14 | 14 | 9 300 | |
| Radio | 2 | 1 | 700 | |
| Direct mail | 30 | 46 | 30 600 | |
| None of these | 28 | 29 | 19 300 | Source: NRS 2025 |
| Buyer profile | All 15+ % | Magazine Readers % | Amount of readers | |
|---|---|---|---|---|
| Interests | Cars, motor vehicles | 25 | 12 | 7 300 |
| Well-being and health | 50 | 65 | 44 600 | |
| Charity work | 13 | 21 | 14 700 | |
| Self development | 32 | 26 | 16 600 | |
| Celebrities | 14 | 23 | 15 300 | |
| Fishing | 16 | 8 | 4 700 | |
| Beauty care and cosmetics | 16 | 18 | 12 700 | |
| Literature | 27 | 49 | 34 000 | |
| Domestic and foreign news | 52 | 52 | 34 600 | |
| Domestic travel | 32 | 34 | 23 300 | |
| Culture | 33 | 50 | 34 000 | |
| Crafts | 25 | 37 | 26 000 | |
| Nature and going outdoor | 52 | 47 | 32 000 | |
| Hunting | 10 | 2 | 700 | |
| Style and fashion | 20 | 26 | 17 300 | |
| Music and concerts | 36 | 36 | 24 000 | |
| Going on summer cottage | 29 | 23 | 15 300 | |
| Local affairs | 55 | 68 | 44 600 | |
| Computer/console/mobile playing | 17 | 6 | 3 300 | |
| Politics | 42 | 43 | 28 000 | |
| Gardening and plants | 30 | 43 | 28 000 | |
| Building and renovating | 34 | 19 | 12 700 | |
| Food and drink | 38 | 37 | 24 600 | |
| Cooking, baking, recipes | 38 | 49 | 34 000 | |
| Investment | 23 | 20 | 13 300 | |
| Decorating | 28 | 32 | 21 300 | |
| Economic and finances | 35 | 33 | 22 000 | |
| Science | 35 | 21 | 12 700 | |
| Travelling abroad | 34 | 21 | 13 300 | |
| Sports, exercising | 45 | 31 | 20 600 | |
| Sailing, boating | 10 | 2 | 700 | |
| Consumer electronics and information technology | 21 | 7 | 4 000 | |
| Environmental matters | 31 | 28 | 18 600 | |
| None of the above | 0 | 0 | 0 | Source: NRS 2025 |
Online & social media
Magazine website
Magazine in Social Media
Average weekly reach & weekly page views
The reach figures and the number of weekly pageviews are the averages of the weekly figures for each month. The weeks are determined as part of the numbers of the month in which the greater part of the days of that week fall. Figures for individual weeks can be seen on FIAM's public weekly list.
Some channels and Followers October 2025
Contact info
Media sales
- Otavamedia Oy
- Uudenmaankatu 10
- 00120 Helsinki
- www.otavamedia.fi
- Mediamyynti Otavamedia
- yrityspalvelu@otavamedia.fi
Media
Publisher
- Otavamedia Oy
Publisher
- Otavamedia Oy
Vastaava päätoimittaja
- Erkki Meriluoto
Address
- Uudenmaankatu 10
- 00120 Helsinki
Postal address
- Uudenmaankatu 10
- 00015 Otavamedia
Phone
- +358 9 15661
- viva@otavamedia.fi